Q: Is there a way to plot triganometric functions in DeltaGraph?
A: Yes. We'll use the example of a sine curve. Follow these steps:
1) Type in some data points that fit the kind of curve you would like to see. What we have done is enter in some random data points in column A. Then use the Formula Builder to populate column B with the sine of the values in column A. This will give you some data that looks similar to the following:
| 0 | 0 |
| 0.78 | 0.7032794192004 |
| 1.57 | 0.9999996829318 |
| 2.35 | 0.7114733527908 |
| 3.14 | 0.0015926529164868 |
| 3.92 | -0.7021462887308 |
| 4.71 | -0.9999971463877 |
| 5.49 | -0.71259162848 |
| 6.28 | -0.003185301793138 |
2) Use this data to create a scatter chart.
3) Turn off the symbols in the Chart->Options dialog so that the chart appears to be blank.
4) Go to the Chart->Curve Fitting dialog. Change the Curve Fitting Type to User defined.
5) Click the Define and adjust the parameters to show the kind of curve you need to see. In this case we might use the following:
Data: x
Model: y= a*sin(x);
Parameters: a=1;
6) Click OK then OK again. The curve should now be plotted. 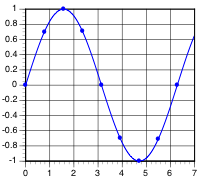
This is the general process you need to follow to plot trig curves in DeltaGraph.